Power Meter 101
I’ll start this off by getting sappy and sentimental on you. This article could not have happened without the help of a LOT of people. In no particular order:
-Powertap
-SRM
-Quarq
-Stages Cycling
-Dr. Robert Chung
-TrainingPeaks
-Our own Dan Empfield, for letting me run a little bit (a lot) wild with this project
The topic is cycling power meters. I wanted to look at this topic from a very basic perspective. Not the usual, “Why train with power?” Most of us have at least a basic understanding of that. If not, there are many resources available, and I’m not going to attempt to do a better job of what has already been done very well.
No, I wanted to look at how power meters work. What do they actually do. I wanted to examine the different styles and locations of power measurement. I wanted to know what actually happens to each piece of data that gets transmitted, received, and recorded. Are all of the systems doing an equally good (or bad?) job of it? What could be improved? And most importantly – how and why? Clearly, I had a very large math problem on my hands. As my research went on, I realized just how big the problem was, and found many more questions than answers.
Consider this the very condensed and distilled version of everything I learned. This article primarily covers SRM, Quarq, Powertap, and Stages – as they are the systems that I have experience with, and the companies that I have direct contact with. There are others out there – Power2Max, iBike, Rotor, Ergomo, and pedal-based systems. I will make mention of these where applicable, but I have not used them.
Last, to all you geeks and or would-be nit-pickers out there, you probably want to stop reading now. Just click ‘back’ on your browser. Some of what I write will likely not suit your fancy. A big part of our job, as journalists, is to explain complicated things in a simple way, so more people can understand them. This also means that if the topic at hand is your career specialty, you’re probably going to find some things that you feel are oversimplified, or not quite written the way you want. I’m sorry, but that’s life. The idea here is to give many people a better understanding of the topic, not few people a perfect understanding.
With that said, let’s dive in to the interesting, fun, and downright scary world of power measurement.
Starting Simple
The first thing you must understand is what power is. It is a measure of the work you do. The whole deal relies on a very simple concept:
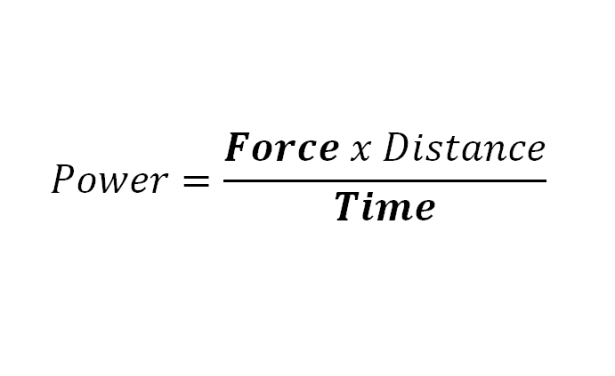
That’s it. You must understand that before moving any further. Perhaps the most simple way to say it is this – 'To produce power, you must do something for a period of time.' For a cycling pedal stroke, we are primarily concerned with the FORCE (your torque input) and TIME (how long you do it); this is why they are in bold in our equation. The distance is the size of the circle your wheel or crank turns (depending on where we measure).
For example, I could do work – requiring power – to move a box from one side of the room to another. I pick up the box, walk across the room, and put it down. However, if I just pick up the box and stand in one place, I’m not actually doing work. Well, I did work to pick it up, but once I have it in my hands and static, no work is being done.
We can also look at this from the perspective of a cycling pedal stroke. If you apply a force to your cranks and spin them one revolution, it requires power and you’re doing work. The force is your torque input into the pedals, and the time is the single pedal stroke. In a very basic way, that’s how crank-based power meters work. You bend the crank (giving a torque number), and it measures the time that it took to complete the revolution (giving time). If you were to do a ‘track stand’ with your weight on the pedals, but not turning the cranks, you are not doing work. Yes, you are applying torque to the crankarms and bending them as you stand – but without the time piece of the puzzle, there is no power.
When we look at cycling, there are two ways to produce a lot of power:
1) A high amount of force over a long period of time ('mashing' at a low cadence)
2) A lower amount of force over a short period of time ('spinning' at a high cadence)
The really fast people are the ones who can achieve both – a high amount of force and a short amount of time. In training or racing, that’s when your legs really start to hurt. Your muscles are producing more power and doing more work.

Above image © Eric Wynn
Types of Power Measurement and Data Transmission
When we say “types of power measurement”, we’re not talking about the location of power measurement. Location refers to the physical place we’re measuring power – i.e. at the crank spider, crank arm, bottom bracket, pedals, or rear hub.
No, we want to talk about the time period used for the different systems, and how they decide to transmit a signal to your head unit. There are two types:
1) Event-based. This type calculates and transmits power information based on ‘events’. For example, with a crank-based power meter, each cadence revolution is an event. That finite piece of time is the starting and ending point for our time in the power equation. Data will not transmit to the head unit if events aren’t happening (i.e. if you stop pedaling).
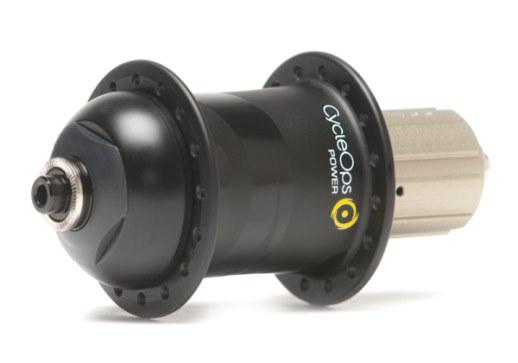
2) Time-based. This type is identical to the above, but with a caveat. Events happen and power is calculated the same – but this information is stored first, and then transmitted at a specific time interval. The CycleOps Powertap hub uses this. Why? Generally speaking, your wheels spin faster than your cranks – and when you stop pedaling, your bike keeps moving. Events happen much faster and for more of your ride, so they essentially bottle them up and shoot data to the head unit at regular intervals of one second.
While it may seem simple, there is more than one way to measure an ‘event’. The easiest way with a crank-based system is to use a magnet and reed switch arrangement. If you own an SRM or Quarq, this is how your system works. The crank contains at least one reed switch, which looks like this:

This little guy has two wires inside of it. When it passes by the magnet that has been placed on your frame, the wires get pulled together. That creates an electrical connection, and gets recorded by the crank. All of a sudden, you have time. If the reed switch passes by the magnet… and then passes by again exactly one second later, your time is one second. That’s also exactly 60rpm. If it took half of a second, that’s 120rpm.
Note that both SRM and Quarq use more than one reed switch. Why do so? Think about this: what if you were waiting at a stop light and doing a track stand. You might push the pedals back and forth a little bit to keep your balance. What if the reed switch happened to be right by the magnet while you did this? It would pass by the magnet over and over again as you keep your balance – tricking the system into thinking you were doing complete pedal revolutions – and giving you a power number. That would be incorrect. The way they combat this is to use another reed switch on the opposite side of the crank. They set up a simple program – IF the magnet does not pass by the opposite reed switch, THEN it will not count the magnet passing by the main reed switch. They call it the “Aim, Fire” format. You must pass by the secondary switch (Aim) before you can Fire the main switch.
Powertap also uses a reed switch and magnet setup. Rather than measuring crank cycles, however, it is measuring wheel RPM. How so? A magnet on the bearing spacer passes by a reed switch in the hub. Or rather – because the axle is clamped static in the bicycle – the reed switch in the hub rotates around the magnet. Each wheel revolution is an event. As we can gather, wheel ‘events’ tend to happen much faster than crank ‘events’. This is why Powertap hubs use time-based measurement. What they’re essentially able to do is pile up a bunch of average power numbers as each force/time equation gets calculated (with each wheel revolution). They collect all of that power data, and then send it out to the head unit at a set interval of once per second.
The new-kid-on-the-block in event measurement is using an accelerometer. As many of you know, this is what Stages Cycling uses in their system, and what the new Rotor power meter is said to use. Rather than using a magnet to figure out time, the accelerometer must create ‘virtual events’. It is trying to figure out where the crank is in space.
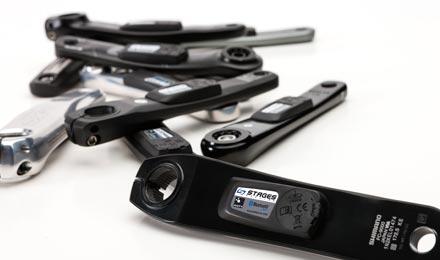
Let’s say that they’ve decided that they’re going to create an event every time the crank is at 3 o’clock in the pedal stroke. If we used a magnet, we could simply place it at 3 o’clock. The accelerometer uses a constant (gravity from the earth) to figure out where 3 o’clock is. As such, critics say this type of measurement is always going to introduce some measure of variability compared to a magnet; it cannot be as perfectly objective. Even if the crank measures the force part of the equation perfectly – if the time is off, your power is off. They can combat this with a more expensive accelerometer, and also by where they set the cutoff frequency (“above X frequency, we’ll consider it to be road vibration, and below X frequency, we’ll call it pedal movement”). The accelerometer will ‘feel’ all movements, so the product engineers must tell it which ones to ignore. Of course, accelerometers carry the obvious benefit of simplicity – there are no magnets, glue, zip ties, and nothing to attach to your frame.
Force Measurement
So far we’ve established what power is (force over time), and we’ve established the different ways that time is measured or calculated. Let’s talk about The Force.
The basic thing you need to know is that power meters are measuring how much you can bend something. That something may be a crankarm (Stages), a crank spider (SRM and Quarq), or a torque tube inside of a hub (Powertap). Based on how much you bend the material, a torque value is measured, which is used to calculate power.
All of the systems we’ve dealt with for this article measure bending by using strain gauges. This handy graphic was provided by Quarq:
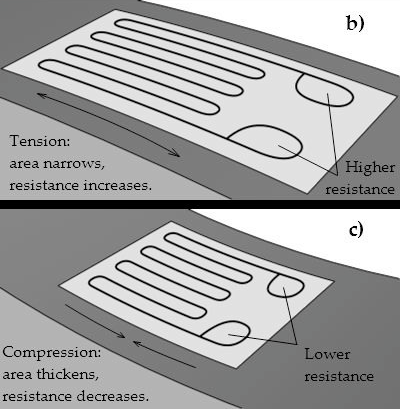
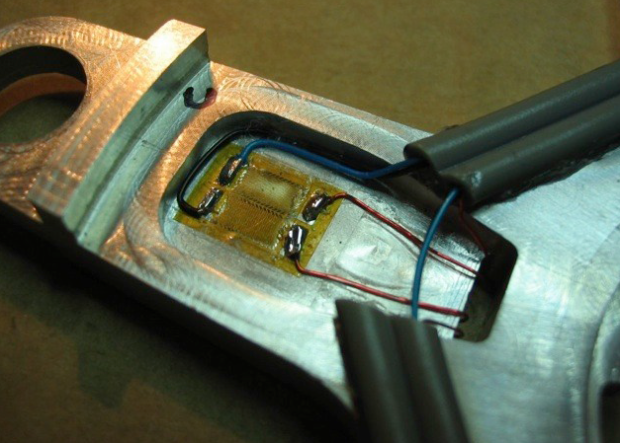
Each strain gauge is placed onto a piece of metal – your crank, crank spider, etc. For accuracy with varying temperatures, they cannot be placed onto carbon fiber (this is why Stages only sells aluminum cranks – and why SRM and Quarq both use aluminum spiders). As the material beneath the strain gauge gets bent via your pedaling, the strain gauge bends along with it. There is a wire coiled up on the strain gauge, which has electric current running through it. As the wire gets bent, more or less current can run through it – and this is what tells us the amount of displacement. A very rudimentary version of this can be seen here:
The arrangement of the strain gauges also plays a key part in accurate measurement. Put simply, we only want to measure the bending forces that contribute to our bike’s forward motion. For a crank, that means we want to measure forward pedaling. You might also twist the arm somewhat while pedaling, but that force does not contribute to the forward motion – the work – you are creating. That twisting force must be ignored. Likewise with a rear hub – we only want to measure bending of the torque tube in the plane that contributes to forward motion.
This arrangement and placement of strain gauges is part of the secret sauce for each manufacturer. If designed and executed properly, the force part of our equation will be perfect. According to SRM, not only does the placement of the strain gauges matter, but also the design of the entire chassis. They say that for this reason, they place their strain gauges exactly between the two chainrings (for accurate readings of both rings), and place their two internal batteries symmetrically within the power meter housing. Also, the lighter weight this whole chassis is, the more error you introduce into the system (attention, weight weenies).
Some people really get hung up on the number of strain gauges with each system, but after doing hours of research, my findings revealed that more doesn’t necessarily equal better. Not only does the number of strain gauges affect the accuracy, but it’s also the type, placement pattern, accuracy of placement on the crank/hub during manufacturing, and design and materials of the chassis that they’re going on to. This applies to all power meters. I’d rather have four perfect strain gauges – perfectly applied to a perfect chassis… rather than sixteen sub-par strain gauges inaccurately placed on a flexible chassis. But maybe that’s just me.
Finally, each power meter must use a Slope to figure out power. What is Slope? According to Quarq:
“The slope is a multiplier used to convert pedaling force into newton meters of torque and, ultimately, into the watts you see on your head unit.”
SRM provided this slope graphic:
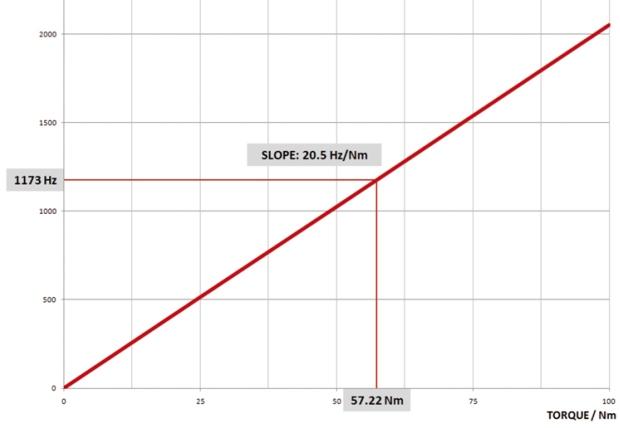
When each power meter gets calibrated at the factory, they’re setting the slope. Keep in mind – if you do the “calibrate” function on a Garmin head unit, you are not actually calibrating anything (they’re using the term incorrectly). What you’re doing is setting the zero offset. It’s like setting the tare on a scale. It does NOT affect the power meter’s calibration. Real calibration needs to happen when major changes happen to the system – a change to a chainring with different stiffness than the original, or new bearings being pressed into a Powertap hub.
Transmission Protocol
Aside from understanding the nuts-and-bolts of power measurement, I wanted to learn more about how data is transmitted to a head unit. As of today, the most popular method is called ANT+. This is a ‘free’ method of data transmission that anyone can use. Each ANT+ transmitting device must be assigned a unique ID code (every power meter, cadence sensor, speed sensor, and heart rate strap). A ‘listening’ device (such as a head unit) just needs to know that unique ID code of the sending device, and it can listen in. ANT+ can transmit information up to 4 times per second.
The other current option for data transmission is Bluetooth. Its clear advantage over ANT+ is that it can transmit data much faster – 64 times per second. The disadvantage is that it is a “closed system”. You must link the sending and receiving devices, and nobody else can listen in. As an analogy, Bluetooth is like having a phone conversation between two people, whereas ANT+ is like speaking to an entire crowd of whoever wants to listen. This becomes important if, for example, you want to use a Garmin 310XT on your wrist for an Ironman – but also want to have your Garmin 500 display power meter data on your handlebar. With ANT+, you can feed information to both head units (the 310XT and 500), whereas Bluetooth can only “talk” to one.
After speaking with all of the power meter manufacturers, everyone had a unique take on what transmission method is best. What also became apparent, however, is that nobody is using any data transmission to its fullest extent, and that there are some very basic limitations due to some very simple realities.
ANT+ has the potential to send data from the power meter, and receive/record it by the head unit four times per second (Note that receiving and recording data are not the same thing). However, that does not mean that the current systems are using that potential. In fact, none of them do. The main reason is that it uses too much battery life. If you look at Garmin, there are two modes – A) recording once-per-second, and B) what they call “Smart Recording”. According to Quarq founder, Jim Meyer, recording every second is the way to go. Under that protocol, the head unit essentially falls asleep between signal transmissions, wakes up once per second to grab the most recent power value, and then falls back asleep to wait for the next one. Just taking a wild guess, it might be ‘awake’ for 0.1 seconds to grab the data, and then fall asleep for the next 0.9 seconds. This means that it is only grabbing 1/4th of the potential data – one of the four data packets. Smart Recording goes further and will repeat power values in your file if it does not detect a change, to save battery and memory capacity (but losing further accuracy).
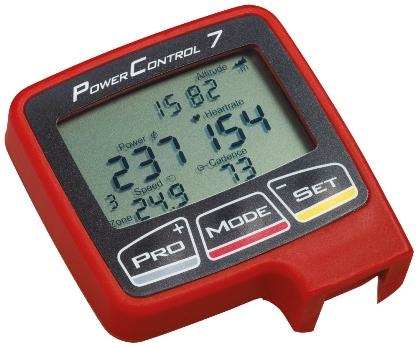
The SRM PC7 is the only head unit that we’re aware of that offers faster recording. The crank sends data four times per second, and is received four times per second by the PC7. However, the fastest it can record data to your file is twice per second (2hz) – which is double the standard 1hz. You end up creating larger power files, but more precise information.
Does this mean Bluetooth is the future? It can send, receive, and record 16 times faster than ANT+. That’s a lot! At first, I assumed that Bluetooth was going to eventually take the cake for those who want super-fine data analysis. But… then I had an epiphany.
The Limitation of Power Meters
It’s a bold heading, but I’ve found it. Despite the limitations of ANT+, it is not the data bottleneck. I don’t think any triathletes are going to analyze files down to the quarter-second anyhow. Bluetooth has the potential to offer much finer data accuracy, but it’s all for naught. The limiter is event speed.
Here’s why.
It doesn’t matter how fast or frequently you can transmit data if you can’t calculate power at an equal rate. Calculating power requires (force over) TIME. I made a graphic to help explain things. The conditions are 60 crank RPM and 19 miles per hour (roughly 240 wheel RPM with a 700×23 tire). This graph represents two complete pedal revolutions.
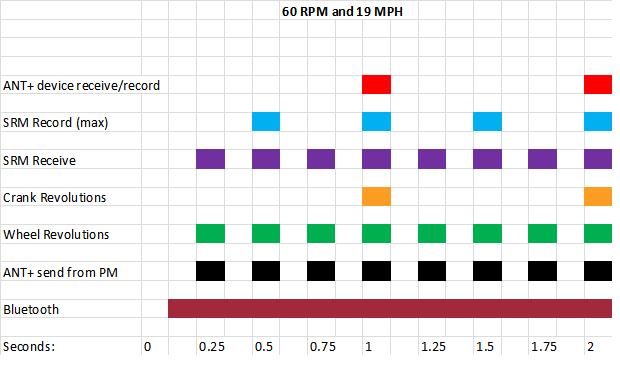
The X-axis is time, split up in to quarters-of-a-second. The top row represents all standard ANT+ devices and how fast they can receive and record information (Garmin, Joule GPS, etc). The next two rows show the SRM PC7, and how fast it can receive and record. Below that is our crankset spinning at 60rpm, or once per second. Next is wheel revolutions. Then, ANT+ sending data packets from the a power meter. Finally, speedy Bluetooth.
Let’s analyze the above graphic, starting from the bottom.
-Bluetooth is constantly sending information (every 1/64th of a second). If you look above at the speed of wheel and crank RPMs, neither are happening fast enough to take advantage of this quick sending speed. It appears that the protocol – in this case – is to keep sending the same power number until a new one is received – which happens ONLY when a new event happens.
-Information can be sent from the power meter via ANT+ every quarter second (regardless of whether we’re using an SRM, Quarq, Powertap, Stages, or Bob’s Power Meter)
-Wheel revolutions: the only system that can calculate power as fast as it can be sent via ANT+ is the Powertap (however, it currently isn’t programmed to send that fast – the max is once-per-second). This also shows why Powertap must use time-based sending. Even at 19mph, the events are happening much faster than the head unit can handle. They collect these average power numbers to create one big average – and shoot that to the head unit every second.
-Crank revolutions are happening once per second at 60rpm (I chose 60rpm for ease-of-math).
-The SRM PC7 receives a new torque frequency number every quarter second (it do not use the ANT+ standard of Ready Calculated Power; it uses Torque Frequency).
-The SRM PC7 can record every half second. At 60 RPM, they’re only getting a time stamp every second, so each of the four quarter-second data packets have the same event time, but each have a unique torque frequency value. What this nets is two unique power values that can be recorded at half-second intervals (both with the same time, but unique torque). Keep in mind, you must go in to the PC7 settings to tell it to record at 2hz (default is the ANT+ standard of 1hz, or once-per-second).
-On the top row, all other ANT+ devices (such as Garmin) both receive data and record it once per second max. At 60rpm, your event speed (crank RPM) perfectly matches the head unit’s ability to record.
Let’s take a look at another example. The wheel speed stays at 19mph, but we’ll double the crank RPMs to 120.
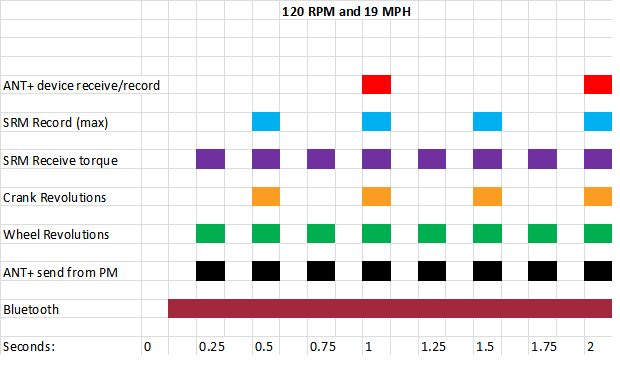
As we can see, at 120 rpm, the cadence events are happening twice as fast (every half-second). This still allows the PC7 to record two unique power values each second (via four unique torque frequency numbers, but now with two unique time values for greater precision). Bluetooth is still blazing away, but is once again limited to the speed of events for how fast it can get new power numbers (so, every half-second for a crank-based power meter). The standard ANT+ devices are still receiving and recording once per second. Although you’re getting a complete new power number every half second from a crank-based system, that data gets ignored by a standard ANT+ head unit. The head unit is assuming that your power output through both half-second cadence cycles were identical.
Last – just for fun, I wanted to take a detailed look at Bluetooth. The following graphic shows one quarter of a second total – split up into 64ths-of-a-second. Both the cranks and wheels are spinning at 240rpm (the wheel is at 19mph).

As you can see, neither the cranks or wheels are even close to keeping up with Bluetooth. Even if we used a Powertap hub and doubled the wheel speed, it wouldn’t matter; we simply cannot calculate power fast enough.
This, of course, does not assume that Bluetooth is bad. In fact, it has huge potential to make any imaginable tool or app with our smartphones, for training aids, GPS, etc (or whatever we want to do to integrate our power measurement with the rest of our lives). For purposes of this discussion, the point was to show that it does not offer any advantage in terms of actual power measurement, due to the inherent bottleneck in event speed. Powertap has the potential to make the best use of it, simply because your wheels turn faster than your cranks (and you can calculate power more quickly because of it).
Who is going to use all that data, anyhow?
I hear you. Even if we could calculate, send, and record power super-duper fast, would it be useful? Do we NEED more than once-per-second? Probably not. At least for triathlon, we’re generally dealing with large pieces of time for our rides and races. If you did a four hour training ride, you probably won’t analyze a segment less than five minutes in length. When that is the case, receiving data every second is probably enough. The case where super-fine analysis is useful is in shorter cycling races. If you’re doing a 100 meter sprint on the velodrome, you might want to look at half or quarter-second power data. Go nuts. Just know that what you need for this is faster events (and calculations of power).
In the next segment of this article, we will take a detailed look at some actual power graphs, to see how all of this geeky stuff fleshes out in the real world. We’ll also talk about the effect of non-round chainrings, temperature change, and more.



Start the discussion at forum.slowtwitch.com