Tollakson vs Wurtele power
TJ Tollakson and Trevor Wurtele raced Ironman 70.3 St George last weekend and here is a detailed look at their bike power data thanks to TrainingPeaks and the analysis of AJ Johnson.
At the 70.3 St. George U.S. Pro Championships last weekend TJ Tollakson and Trevor Wurtele both had strong bike rides. It was a stacked field, and both athletes pulled off top ten finishes. They were kind enough not only to let TrainingPeaks view and analyze their data, but they also graciously let us get a few words in with them after the race. Here is a look at the numbers and their comments to show just how it broke down.
View Trevor Wurtele’s PowerTap data in TrainingPeaks
View TJ Tollakson’s SRM data in TrainingPeaks
THE FIRST MILES
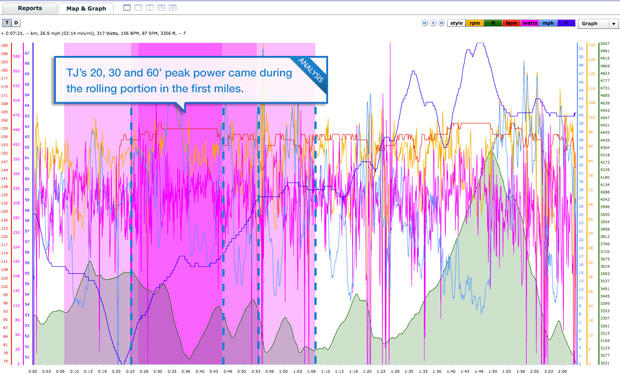
TJ exited in 24:18, a bit slower than he expected. He was with Ben Hoffman and Greg Bennett and the trio quickly caught the main group. They were surprised at how quickly they were able to do this. "It was pretty easy. We caught those guys pretty quickly," said Tollakson. "When there's a group that big a lot times early in the race everyone is just sitting around looking at what everyone else is doing." Still, Tollakson’s peak 20, 30 and 60-minute values are all in the front half of the race. His peak 60-minute power starts just three miles in, and he covers 26.9 miles in that hour at an average of 317 watts, or 4.29 watts/kg while gaining 1148 feet of elevation as reported by his SRM.
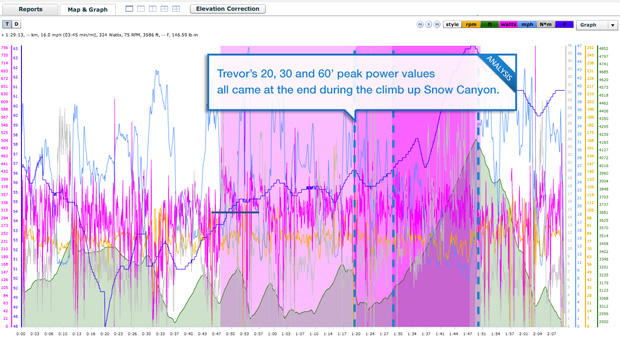
Trevor was out in 25:54 but didn’t hammer the first miles. "The first hour was surprisingly easy. I was going with Jordan and it felt comfortable," Wurtele commented. Then he and Rapp caught a pack and Wurtele made his move. "At mile 20 it bunched up and I decided I was going to go for it," Wurtele said. His file reflects that, as his peak 60 starts at mile 21, only 48 minute in, and goes until he tops Snow Canyon at mile 44. Wurtele covered 22.5 miles in that hour at an average wattage of 315 (4.21 watts/kg) and gained 1988 feet according to his PowerTap.
So while both riders have relatively common metrics in what they averaged for their 20, 30 and 60-minute peak values, they came at different points. This is simply a function of racing and working with what you have and who is around you.
Below is a screen shot of TJ Tollakson's peak values.
And here is a screen shot of Trevor Wurtele's peak values.
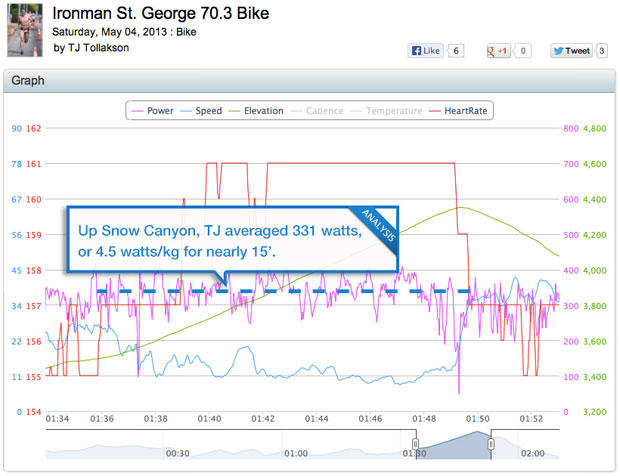
ATTACKING SNOW CANYON
This 3.5 mile climb is the signature feature of the St. George bike course. Coming at mile 41, it is 3.5 miles long with a 4.6 percent average gradient. While you may think that Tollakson was a bit cooked having put his peak values out prior to the climb, that wasn’t the case. He still hammered a 4.48 watts/kg average for nearly 15 minutes.
Trevor said he was on his own for the climb and was a bit apprehensive having already ridden hard. Still, he pushed 324 watts and averaged 4.33 watts/kg. "Once I got to the climb I was out of the saddle and using a few different muscles," Wurtele commented.
STAYING STEADY
On a hilly course like St. George you could forgive an athlete for having a high Variability Index, or VI. The VI is essentially a measure of how evenly a rider paced the bike. On a hilly course, many athletes may hit the hills hard, then recover on the down. As Tollakson mentioned, his goal was to “level load” or pace steadily. For the entire ride his VI was 1.04, a very low number for this course. The goal is to be as close to a VI of 1.0 as possible, but on a course with a profile like this, a 1.04 is as close to perfect as possible. Wurtele was close behind with a VI of 1.05.
How did they pace so well? Tollakson particularly paid attention to his overall effort. “I’m not trying to hammer the downhill, I’m trying to level load as much as possible,” he said. “I try to have 10, 12 percent higher watts on the uphill than I do on the downhill. But with my aerodynamic position and my bike I really need to take advantage of the speed on the downhill.” For reference, he was spinning out his 54×11. “I had periods of time on the uphill where my watts were even higher, but it doesn’t make sense to just totally recover on the downhill when you can take advantage of the aerodynamics and speed,” said Tollakson.
EXECUTION
It certainly wasn’t by chance that both athletes had good numbers on the bike. After the race TJ and Trevor commented on how they used their power meter on race day. “I’m looking at my watts the whole time any time I’m training or racing,” said Tollakson. “I know I don’t want to ride much over 330 watts because then I’m starting to burn matches in a half Ironman.” Looking at his file, there are certainly spikes, but no real matches burned.
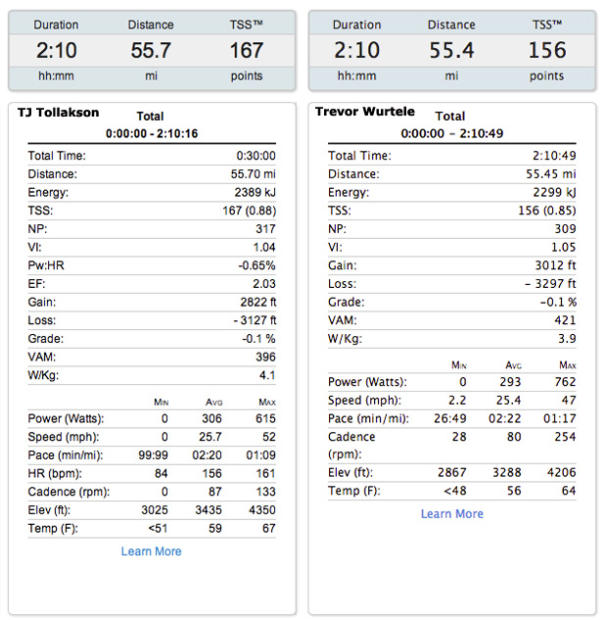
Wurtele’s file is very similar in that he has spikes, but no long periods (30 seconds to two minutes) where he is over his FTP by a high enough percentage to constitute a match. “I look at the numbers for sure,” Wurtele said. “I’d like to average 310 watts Normalized. I’m not too concerned about the spikes.” His attention to the numbers paid off as he hit a Normalized Power of 309.
Neither athlete felt they would do anything different on the bike. “I think I did it well. I cracked a bit in the last miles of the run but maybe I lost 10 to 15 seconds and I made that up on the bike,” Wurtele said afterwards. Tollakson was equally happy with how he paced it, and with the second fastest ride of the day (only Sebastian Kienle was faster), he should be.
When asked if they would do anything differently, both athletes had virtually the same comment: swim faster.
For more power analysis from Ironman St. George 70.3, visit TrainingPeaks.com/StGeorge
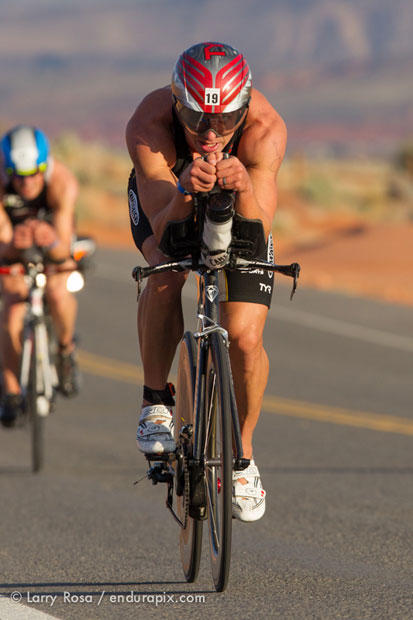
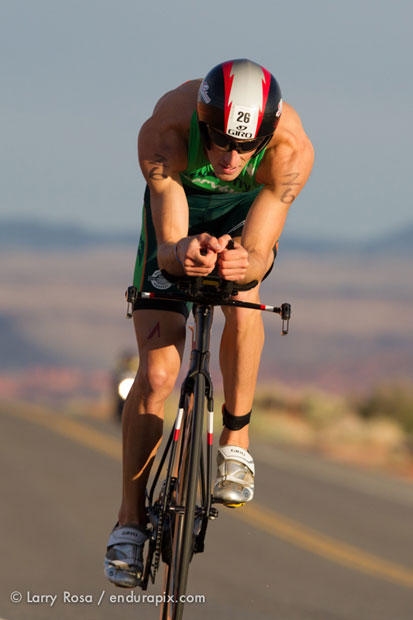
The action images are courtesy of Larry Rosa of endurapix.com