To provide the best experiences, we and our partners use technologies like cookies to store and/or access device information. Consenting to these technologies will allow us and our partners to process personal data such as browsing behavior or unique IDs on this site and show (non-) personalized ads. Not consenting or withdrawing consent, may adversely affect certain features and functions.
Click below to consent to the above or make granular choices. Your choices will be applied to this site only. You can change your settings at any time, including withdrawing your consent, by using the toggles on the Cookie Policy, or by clicking on the manage consent button at the bottom of the screen.
The technical storage or access is strictly necessary for the legitimate purpose of enabling the use of a specific service explicitly requested by the subscriber or user, or for the sole purpose of carrying out the transmission of a communication over an electronic communications network.
The technical storage or access is necessary for the legitimate purpose of storing preferences that are not requested by the subscriber or user.
The technical storage or access that is used exclusively for statistical purposes.
The technical storage or access that is used exclusively for anonymous statistical purposes. Without a subpoena, voluntary compliance on the part of your Internet Service Provider, or additional records from a third party, information stored or retrieved for this purpose alone cannot usually be used to identify you.
The technical storage or access is required to create user profiles to send advertising, or to track the user on a website or across several websites for similar marketing purposes.


Goes to show investing in the sport and sponsoring the right athletes can bring a return.
Thanks for the bike count. More ‘other’ than I expected.
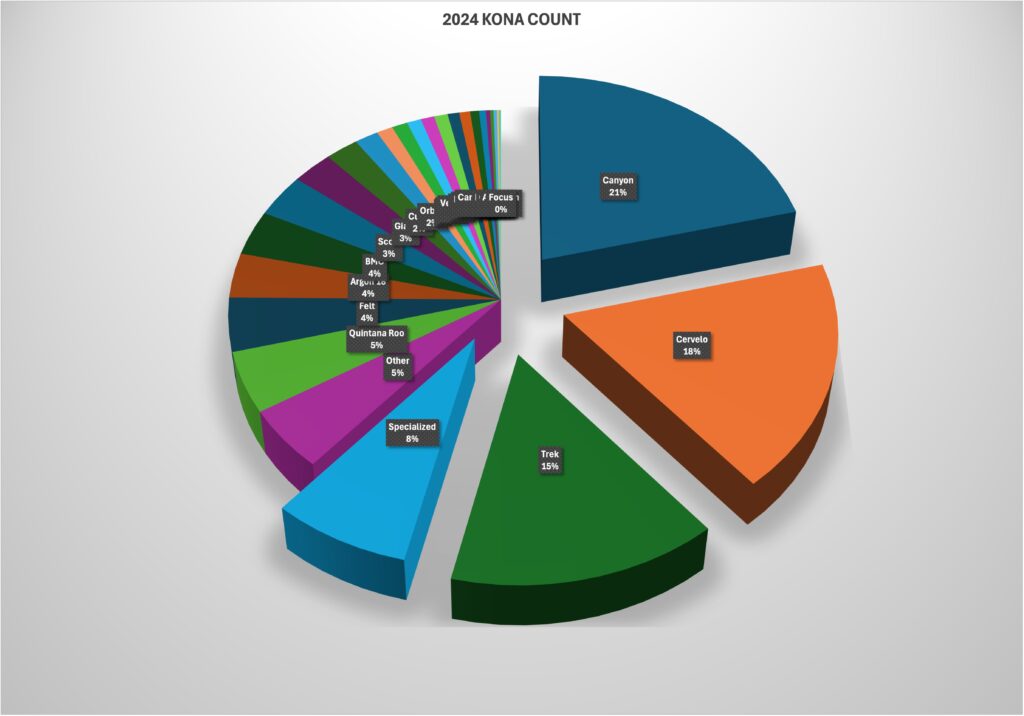
That’s a shocker of a pie graph, can’t see half of the names
Read the article. There’s a list of names and percentages.
The point of the graph is to get a visual instead of reading through text and tables
They simply have to move the legends outside the pie. But it’s a silly, easy to fix blunder.
Love the pie chart, do you guys use Harvard Graphics?
23 Cadex bikes is wild. More than Pinarello, Dimond, Ventum, and other wayyyy more established brands.
Not to mention they didn’t even bother to sort the table. Would have been nice to go from highest to lowest.
EDIT:
Oh look I can sort the table within the article! I strike my previous comment.
I am guessing within 5 years Van Rysel tops it
I’ll take that bet. No chance.
They already release the uci version at 7500 (ultegra di2) that is “only” 1000 euro less than a speedmax clx.
Cube aerium / orbea ordu are already cheaper so not sure
Can Rysel have resources that make Canyon look like the paperclip budget. they’ve gone all in. They’re about to repeat Canyon but with the leverage a top 5 sports business in the world would commit
Poor adjustability. They’re going to need to improve the bike to keep gaining traction after the initial surge of people that get excited about a new, budget offering.
And the Ventum is going to be very price competitive
Yes, Giant is such an unestablished brand/manufacturer.
Who says they are making a return? Marketing is very expensive and they do the most of it.
Decathlon (van Rysel) may have have resources that could trounce Canyon by some margin, however, so did Wal-Mart, and well Viathon is a dead company. So um, van Rysel has a very high chance of being dead before it ever sells 1,000 tri bikes.