Who is the King of Power from Kona 2024?
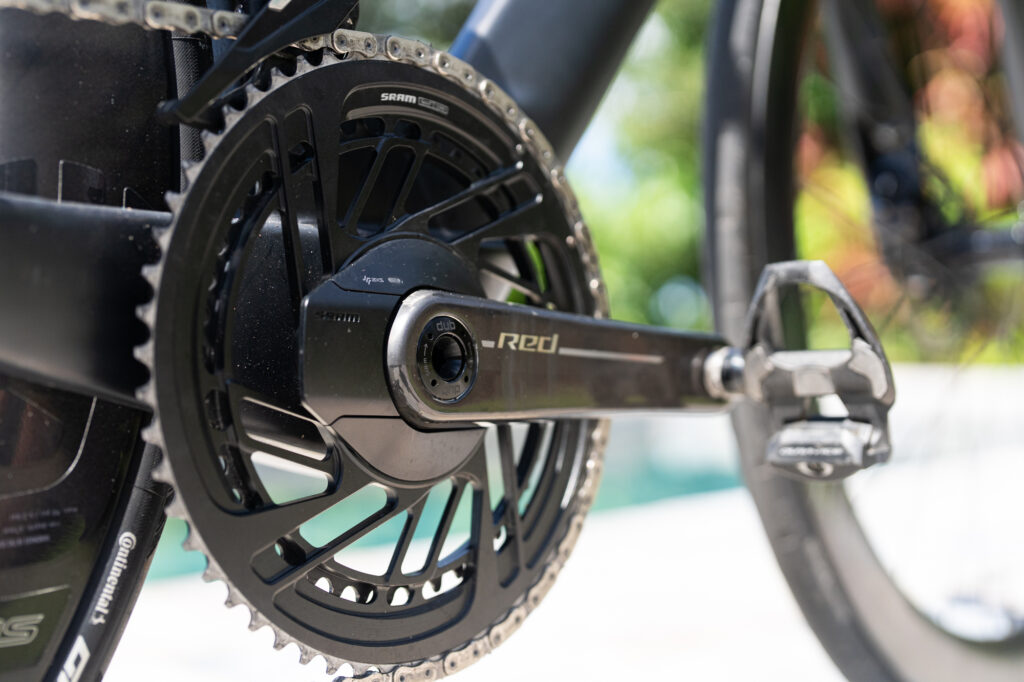
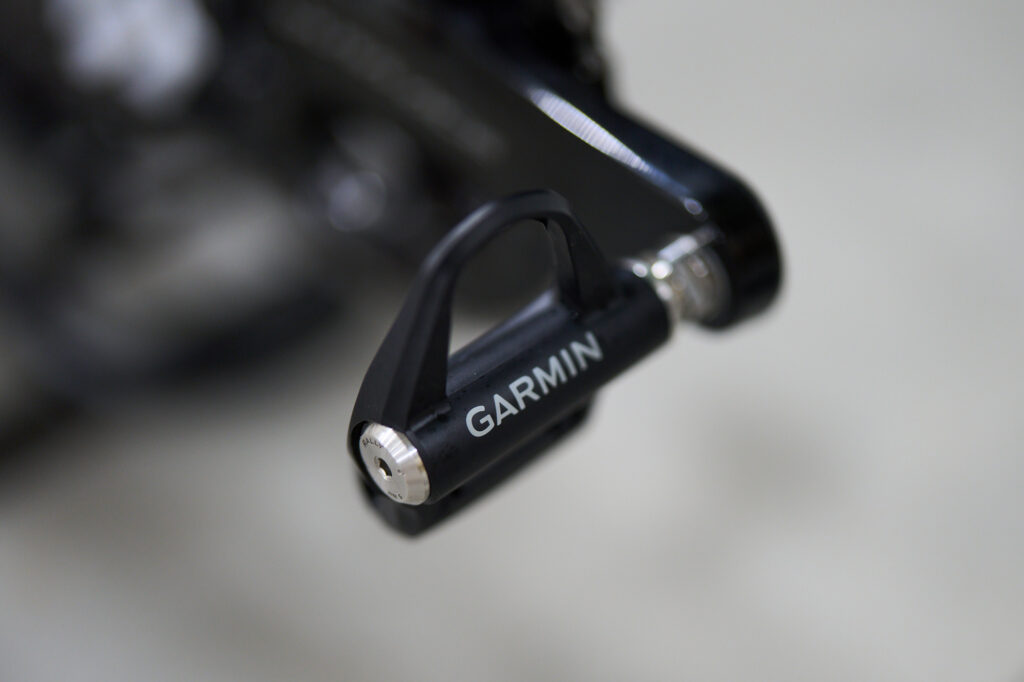
Thanks, at least in part, to the folks at Strava and Zwift, power is king to all the geeks. I would say this is perhaps even more so than watts saved in the wind tunnel. Power is something we see everywhere. Even if you don’t have it on your bike, Strava just makes it up for you. It’s so sacred that some pros won’t even share it.
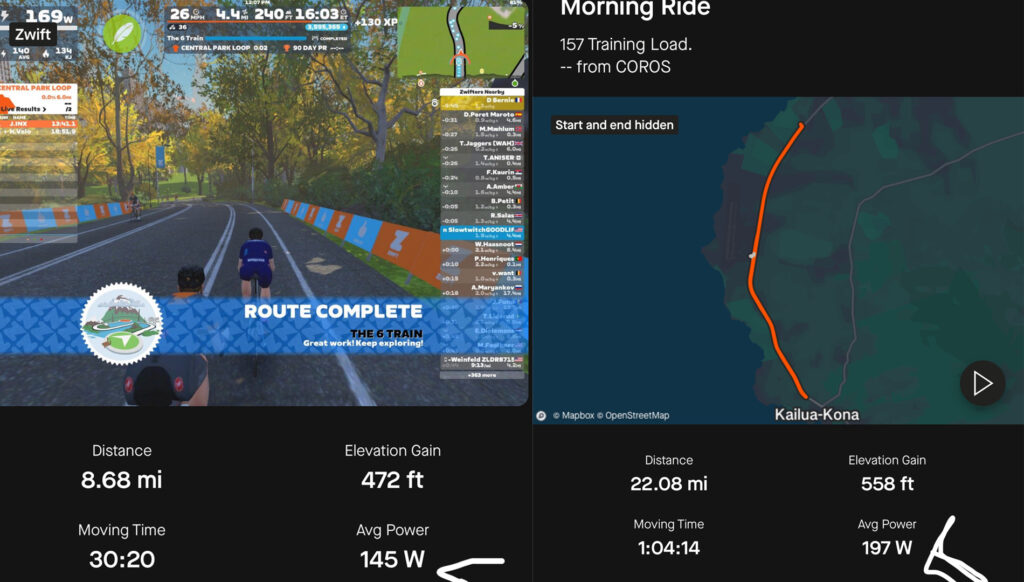
Power started to come into cycling in the late 1980’s. It began with wired rear-wheel hubs, worked its way into cranks and Bluetooth and ANT+ data transmission, and then moved into pedals. It’s become one of the most recorded data sources next to HR for all things performance.
Like anything we have in our quiver, it is something that can be a huge help and, at the same time, can be a huge deterrent if not used correctly. So, who is leading when it comes to the source of your power?
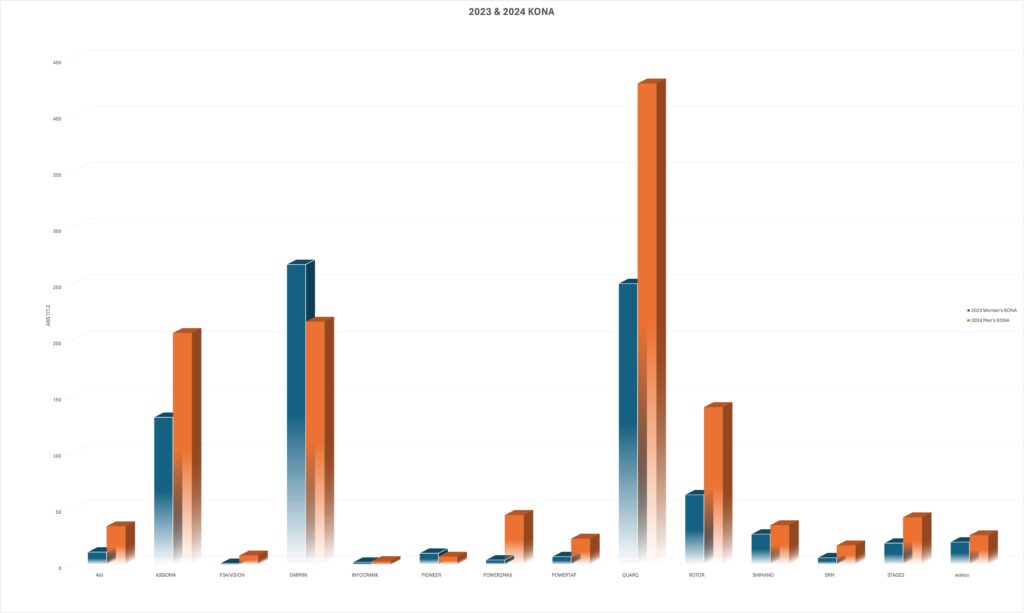
Assioma made huge inroads on Garmin (compared to 2023 Kona), while Quarq remains the top dog. 2023 is in blue, and 2024 is in orange above.
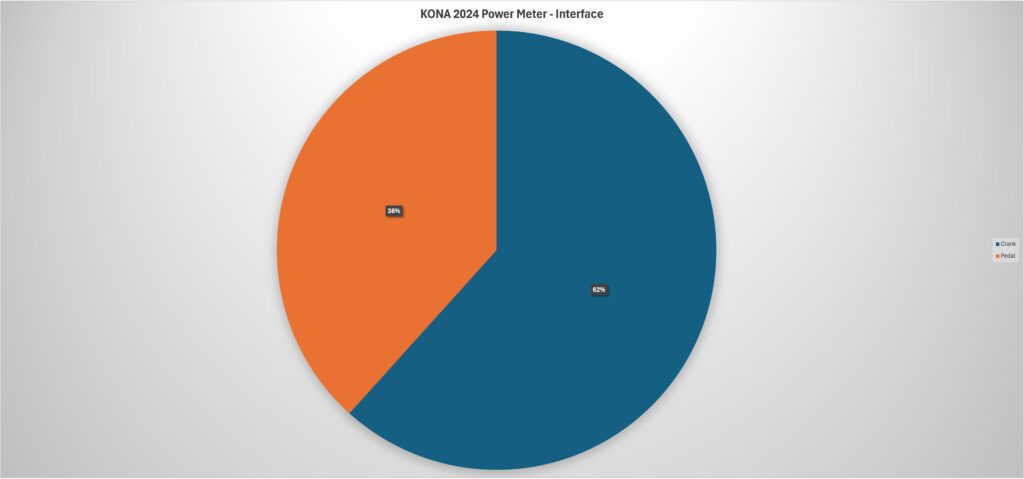
Now, moving on to the men’s 2024 race, it appears that men have a larger appetite to have power-based cranks than pedals, compared to the women’s race here in 2023. We see from the 2024 stats that 62% of power meters were crank-based and 38% were pedal-based. The women last year were almost the exact opposite, with 30.1% crank power and 69.9% pedal power. And last month in Nice, there were even more pedal-based power meter’s on women’s bikes than there were at 2023 Kona.
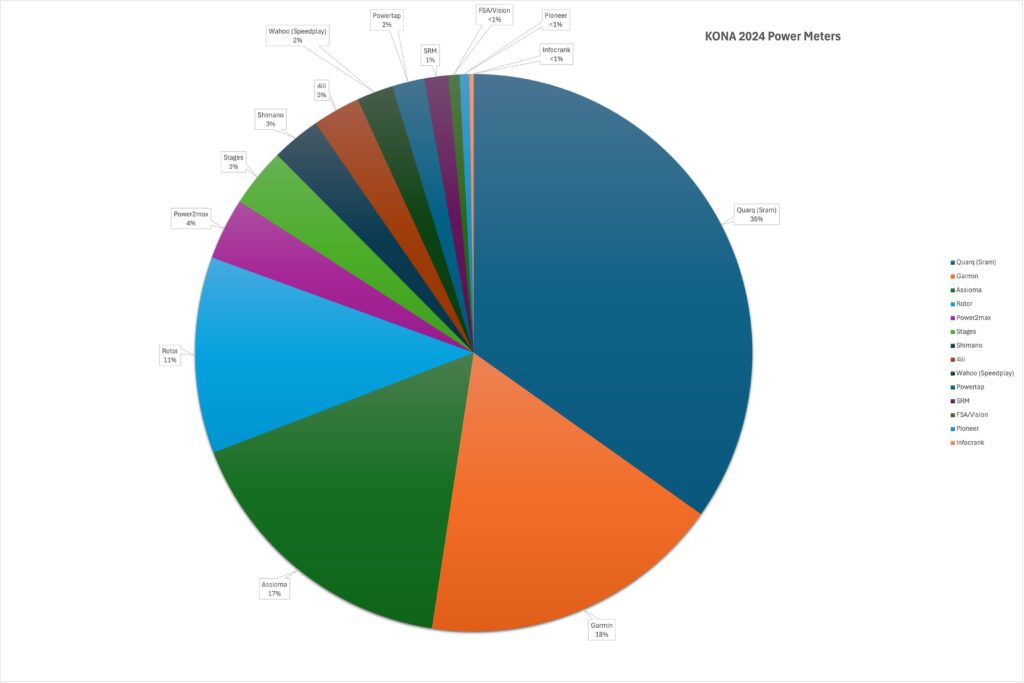
The total breakdown was not all too out of the norm. We generally see the cranks win, but I will say that over time, that percentage is shrinking as we have more power pedal companies in the mix. With everyone having an N+1 bike need, it’s the most affordable way to get power on all your bikes. This is probably why Assioma is gaining so much traction on Garmin — they are about 30% less expensive for equivalent products.
The bigger question is not if, but when will Shimano and SRAM come out with a power pedal?


From the title I was hoping you had gotten access to all the pros power files!
Unless I missed it, what percentage of bikes had some type of power meter?
Didn’t SRAM have one already called PowerTap?
The legends of the graphs are no easy to read
Pro Tip: Try just punching the raw data into ChatGPT (either upload Excel or just paste in data) and make prompts like “Please make a pie chart showing distribution of the brands”
Here is the Market Share Data represented by ChatGPT from an uploaded Excel file (with your data). I just uploaded the file and ChatGPT itself made this graphics, recognizing that it was market share data
And here is a short prompt I made:
ChatGPT answering that, actually without me providing this data. I am unsure if the data is correct or where ChatGPT is getting this data from - 87% sounds plausible. Maybe OP can confirm?