
1 of 8 photos
Definition
Yaw angle is the angle between a cyclist’s direction of motion and the relative wind vector. It is not the angle between the cyclist’s direction and the ambient wind direction. The relative wind vector is the combination of rider speed and the ambient wind direction. As it is a vector sum, the magnitude as well as the direction is important.
Yaw angle is the angle between a cyclist’s direction of motion and the relative wind vector. It is not the angle between the cyclist’s direction and the ambient wind direction. The relative wind vector is the combination of rider speed and the ambient wind direction. As it is a vector sum, the magnitude as well as the direction is important.

2 of 8 photos
Yaw angle can be visualized as the angle between your direction of travel and the string of a balloon. Because of the vector sum, the higher the cyclist’s speed, the lower the relative yaw angle.
Probability Distributions
The effective yaw angle that a cyclist experiences is a probability distribution which is a function of wind direction and speed as well as rider direction and speed. The probability distribution function for yaw angle is a Gaussian distribution (normal distribution or bell curve). This means that the low yaw angles will have higher probability than large yaw angles. It also means that the curve will nearly always have a maximum centered at 0 degrees. The shape of the curve varies according to ground speed and wind speed. As the yaw distribution for a cyclist is a function of 3 key parameters, a different distribution will be generated for a specific location and rider speed. The result is that experimental data collected on the road will vary between tests.
However, considering the trends in data from a range of sources provides a good overview of the yaw angles experienced by cyclists in real world conditions.
Published Data
Cooper 2003 – Truck Aerodynamics Reborn – Lessons from the Past
While environmental data in cycling is relatively limited, there has been considerable research into the environmental effects on the aerodynamics of road vehicles, particularly heavy vehicles (trucks). This figure, taken from Cooper (2003), shows the probability of exceeding a given yaw angle with three curves for different road speeds based on hourly-mean wind statistics. While the figure is referencing vehicle speeds, the trend in the data clearly shows that higher road speeds result in lower yaw angles. Extrapolating to speeds lower than 30 mph for cycling we could expect a further dilation of the curve, thus increasing the spread of yaw angles. However, at 30mph, a typical aerodynamic reference in cycling, it can be seen that a vehicle will spend at least 70% of the time at yaw angles below 10 degrees.
This chart combines positive and negative yaw, thus the peak at zero degrees at the left of the chart.

3 of 8 photos
Mavic
Mavic measured the yaw angle experienced by a rider at Kona using a bicycle mounted vane potentiometer (angular position sensor). Results show that their rider spent 70% of time between negative and positive 10 degrees. And this is measured at Kona, a notoriously windy location for cycling. The report does not discuss consideration of the rider’s forward interference on the probe.
Mavic measured the yaw angle experienced by a rider at Kona using a bicycle mounted vane potentiometer (angular position sensor). Results show that their rider spent 70% of time between negative and positive 10 degrees. And this is measured at Kona, a notoriously windy location for cycling. The report does not discuss consideration of the rider’s forward interference on the probe.

4 of 8 photos
This chart notes percent of time spent at various yaw angles, showing positive yaw on the right and negative yaw on the left, thus the peak between negative four and positive four degrees at the center of the chart.
This data is direct yaw measurement and therefore combines changes in road and wind speed together. This is a limitation from an analytic perspective, as yaw angle is influenced by changes in rider speed. However, being measured on location by a real cyclist, this data provides a good representation of conditions that could be expected by athletes on course.
FLO Cycling
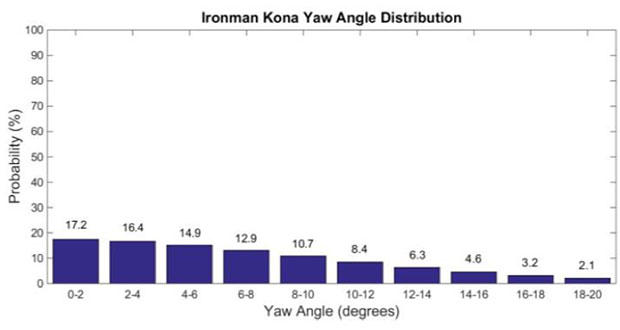
FLO Cycling measured the yaw angle experienced by a cyclist experimentally using a bicycle mounted system. Data was measured over several Ironman courses and the collated data averaged to generate a single average representation of yaw angle. The resulting distribution is shown below grouped into 1 degree ranges. The result of this testing showed that 79 percent of time was spent at less than 10 degrees yaw.
This data is direct yaw measurement and therefore combines changes in road and wind speed together. This is a limitation from an analytic perspective, as yaw angle is influenced by changes in rider speed. However, being measured on location by a real cyclist, this data provides a good representation of conditions that could be expected by athletes on course.
FLO Cycling
FLO Cycling measured the yaw angle experienced by a cyclist experimentally using a bicycle mounted system. Data was measured over several Ironman courses and the collated data averaged to generate a single average representation of yaw angle. The resulting distribution is shown below grouped into 1 degree ranges. The result of this testing showed that 79 percent of time was spent at less than 10 degrees yaw.

5 of 8 photos
This chart notes percent of time spent at various yaw angles, and combines positive and negative yaw, thus the peak near zero degrees at the left of the chart.
This method is analogous to that employed by Mavic, where yaw angle data is direct yaw measurement and therefore combines changes in road and wind speed together. The report also does not discuss consideration of the rider’s forward interference on the probe.
Swiss Side
Swiss Side also sampled data using a bicycle mounted system. Swiss Side stated that athletes used the bike in training and so data was collected over a range of days, roads and wind conditions. Therefore this is a broad average of the yaw angles experienced by a cyclist. In-house software was used to filter and analyze the data to generate the curve seen below.

6 of 8 photos
Results show that the probability of experiencing a yaw angle below 10 degrees (either positive or negative) is of the order of 95 percent. This is significantly lower than that seen by FLO or Mavic. However, this is consistent with the fact that the Kona bike course exposes athletes to higher than normal cross winds and hence yaw angles.
This chart shows the fraction of time spent in yaw angle range, positive yaw on the right and negative yaw on the left, thus the peak near zero degrees at the center of the chart.
Catalyst Bike
Catalyst wheels used a theoretical approach to generate the expected yaw weighting curves for three specific Ironman courses.
Without experimental data, it is still possible to model the yaw distribution given knowledge of the three parameters: wind speed, direction, and rider speed. Rider speed is arbitrary but was modeled at a constant 25mph. The probability of a given wind speed was then modeled using a Rayleigh distribution, a practice utilized in wind engineering modelling. This function was then transformed according to the average wind speed measured at three Ironman courses; Chattanooga, Arizona and Kona. For a theoretical study, the wind direction can be modeled with an equal probability from any direction.

7 of 8 photos
8 of 8 photos